




Business Intelligence for e-commerce
Discover where your business is losing profit—and change it
Get a ReportWhat changes in your business after implementing Business Intelligence
Management analytics is not about beautiful charts. It is about a systematic transition from intuitive decisions to decisions based on real data from your business. When you see the full picture, profit grows because the number of costly mistakes decreases.

Profit/Expense Control:
You see not only revenue but all expenses broken down: where the budget is spent and how much remains after advertising and operational costs.

Margin per Product:
You know exactly which items generate profit and which drag margins down—and you adjust your assortment based on data.

Advertising Channel Effectiveness:
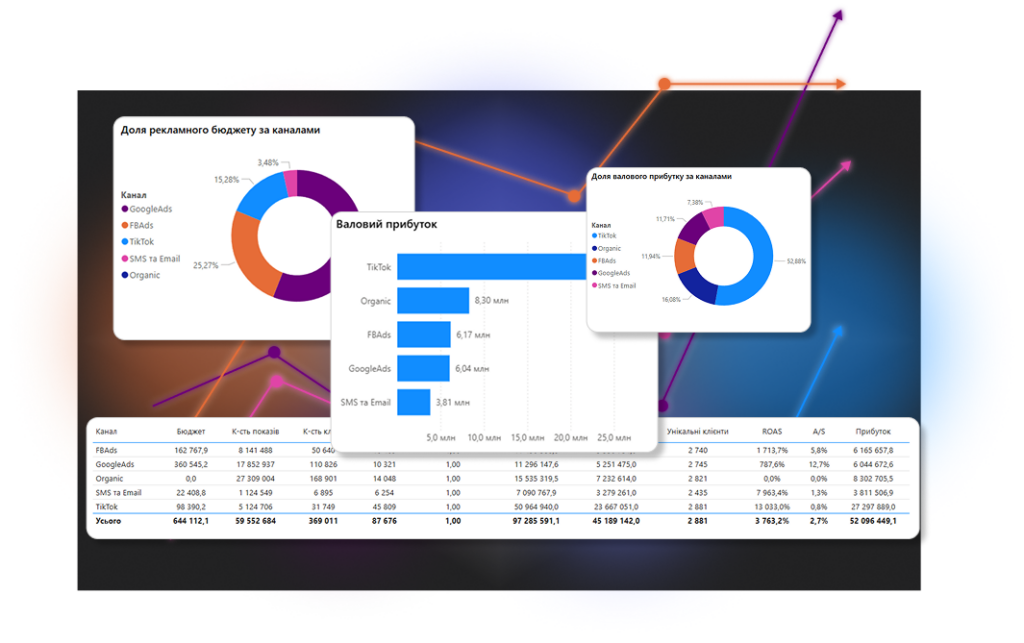
ROAS analytics shows not just return on ad spend, but net profit per channel—Facebook, Google, organic, retargeting.

Customer Analysis:
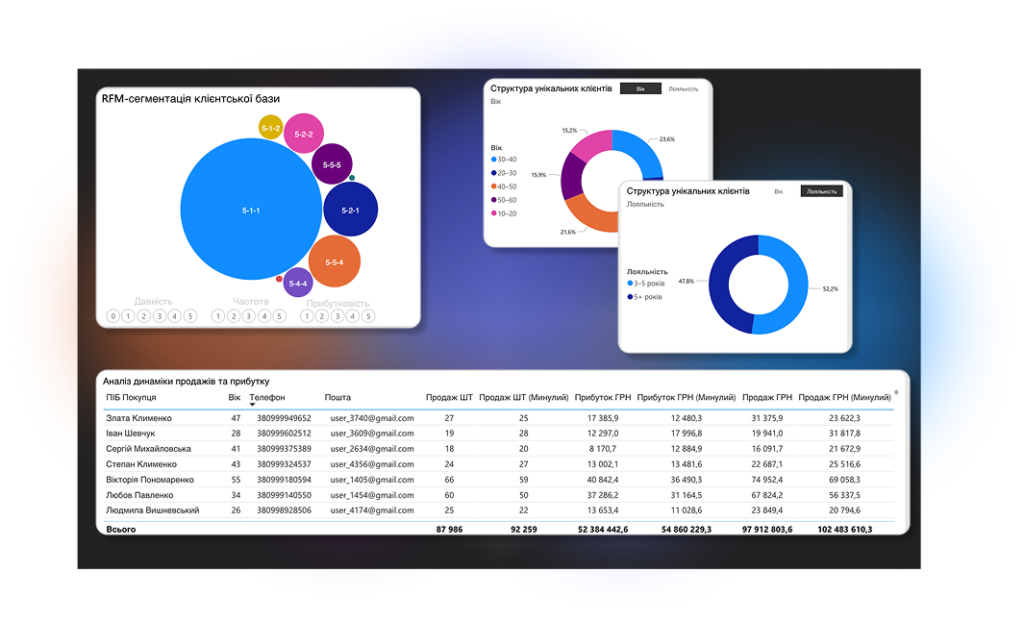
Segmentation helps you understand who generates the most revenue and who should be targeted with marketing.

Understanding Your Customer Base:
RFM segmentation divides customers into groups: who pays the most, who is leaving, who should be brought back—and how.

Identifying Budget Waste:
BI analytics automatically shows points where money is spent without results—and you react immediately, not at the end of the month.
5 Signs Your E-commerce Needs Business Intelligence Right Now
Many e-commerce businesses face a situation where advertising metrics grow, but profit does not increase. The owner sees revenue but does not understand what actually generates money. The reason is often not in advertising or the product—but in the absence of a unified analytics system.
What You Will See in Your Analytics
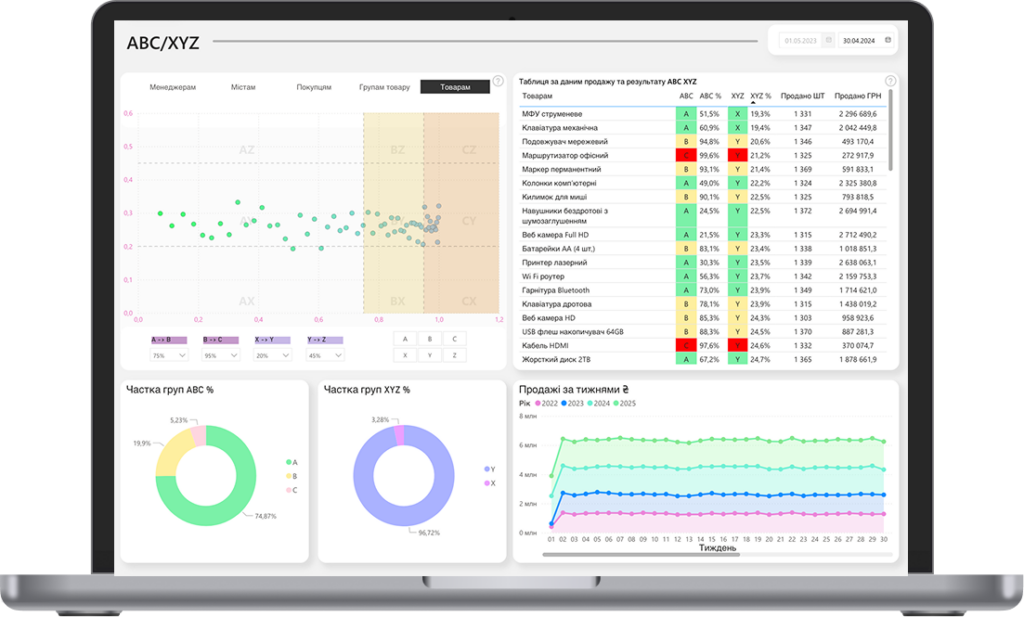
ABC/XYZ Product Analysis
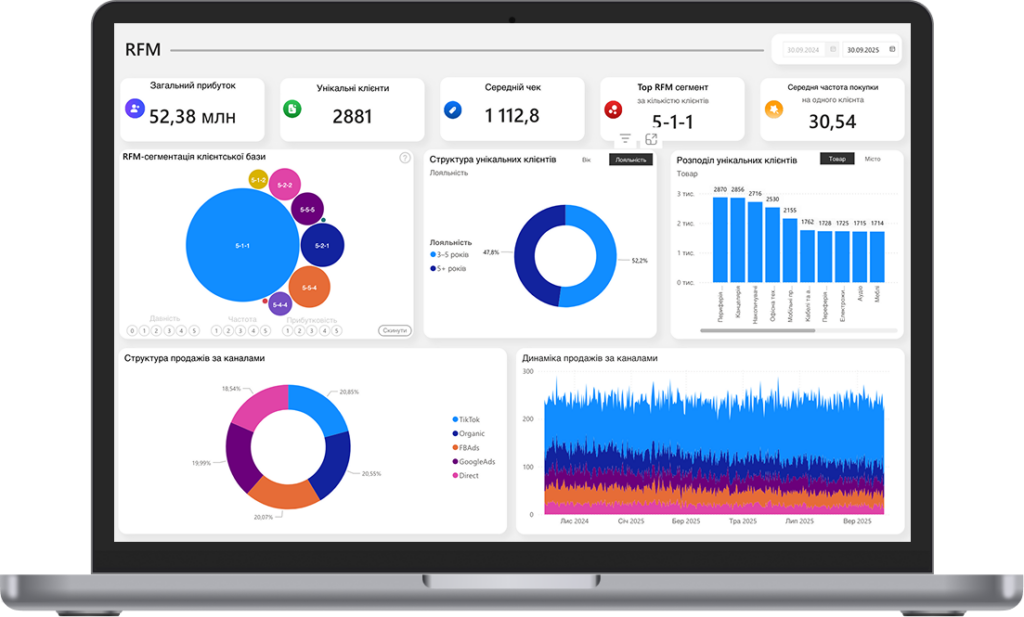
RFM Customer Segmentation
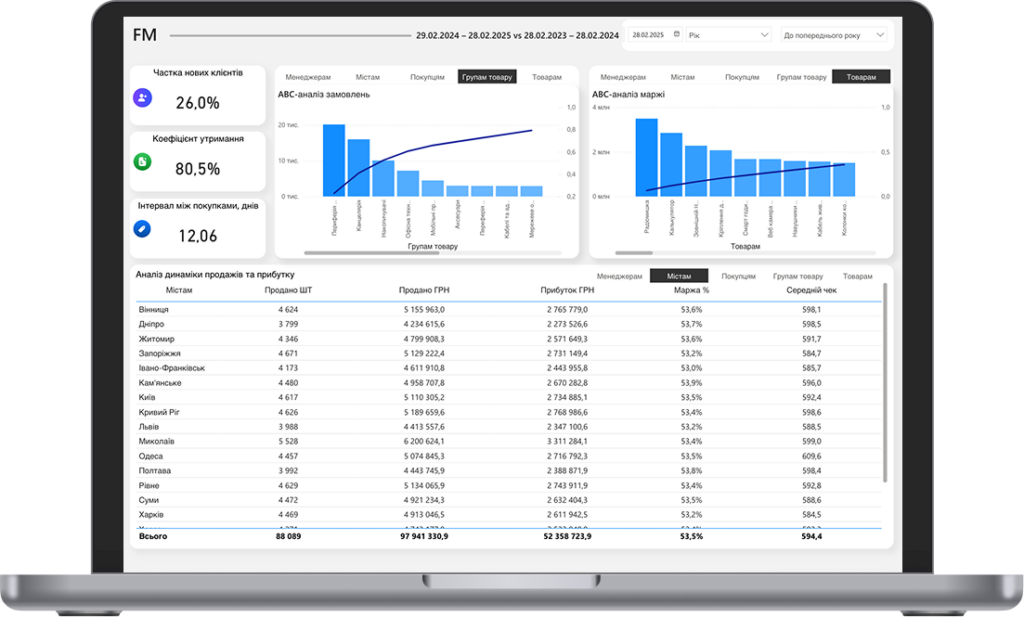
FM Customer Segmentation
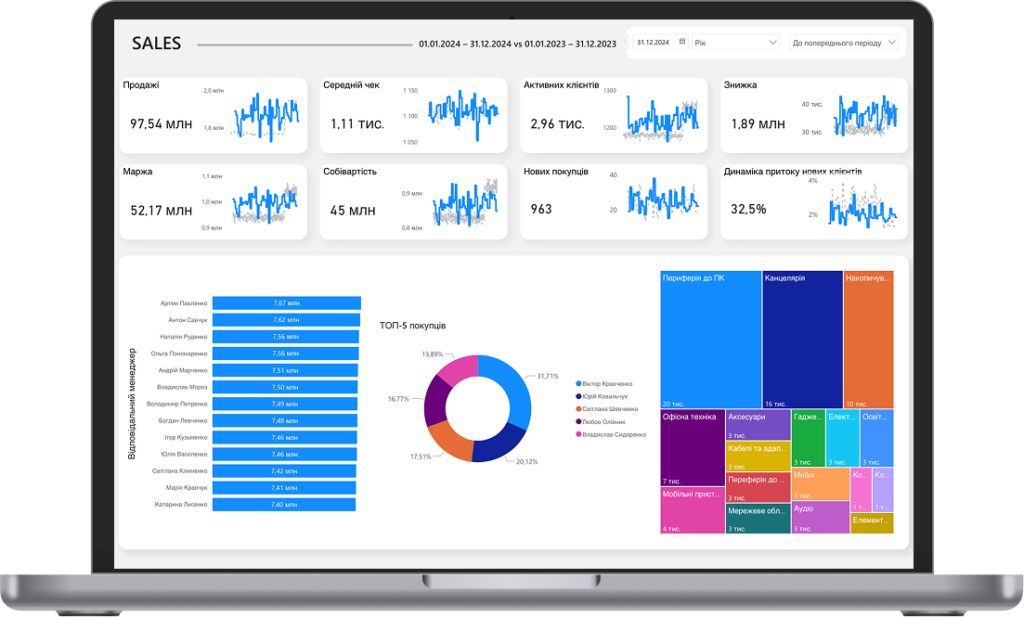
Profitability Analysis
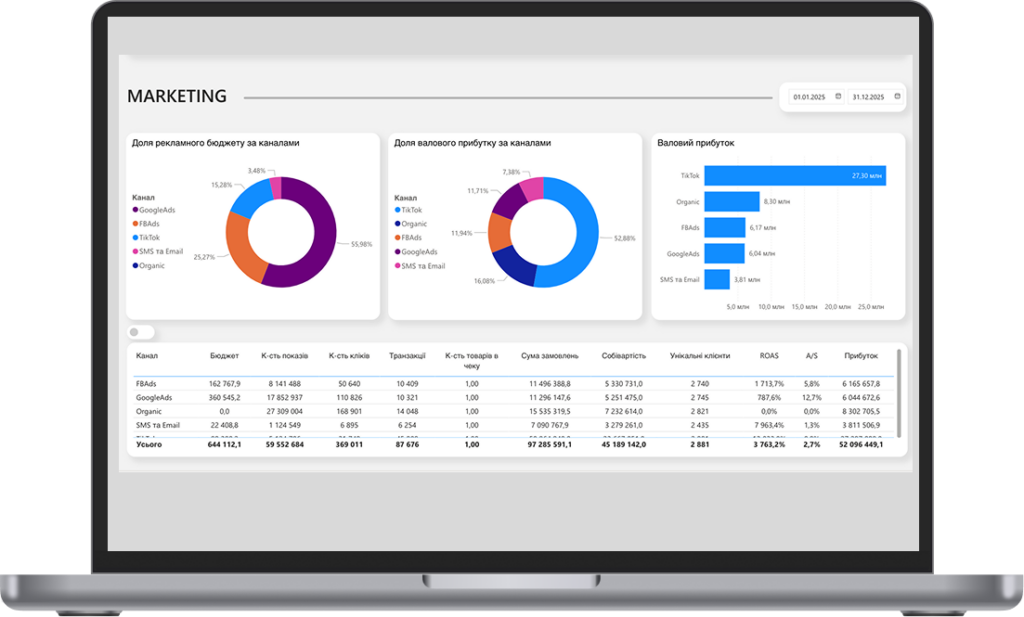
Advertising Channel Analytics
What is included in the BI package for e-commerce: full composition for $200/month
5 Dashboards in Power BI
These are not template reports—each module is designed for real e-commerce tasks: from daily profit control to identifying products that drag margins down. All 5 dashboards are interconnected: you move from general to specific in a few clicks, without switching between systems.
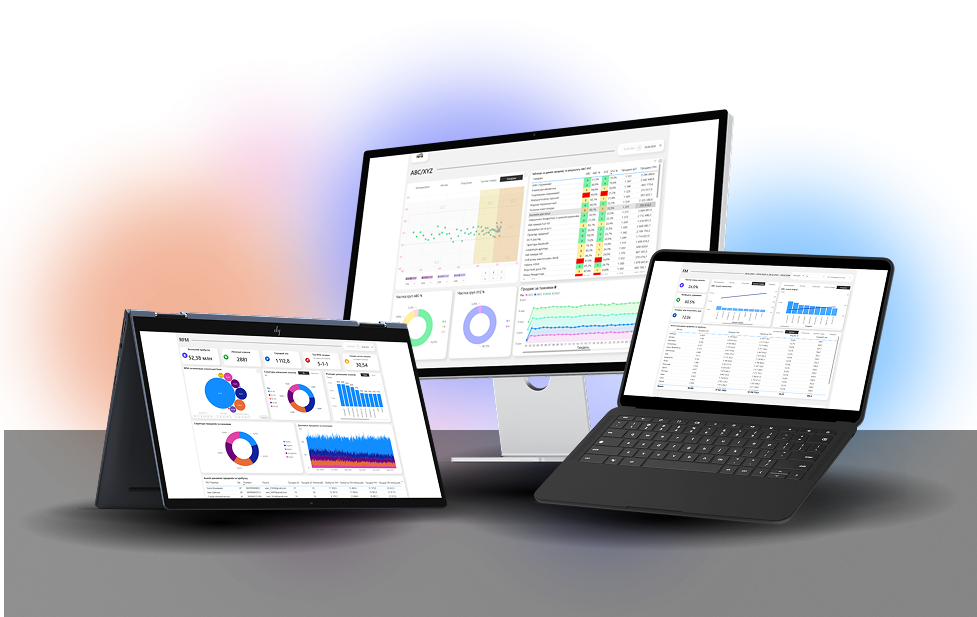
RFM Segmentation with Export
The system automatically divides the base into segments. You receive a ready file for upload to any other service—and launch personalized campaigns without additional analyst work.
Advertising Analytics Dashboard
Everything in one window—Facebook, Google, organic. You see not just ROAS, but net profit per channel after all costs. Budget reallocation decisions take minutes, not days of manual data collection.
Continuous Data Updates
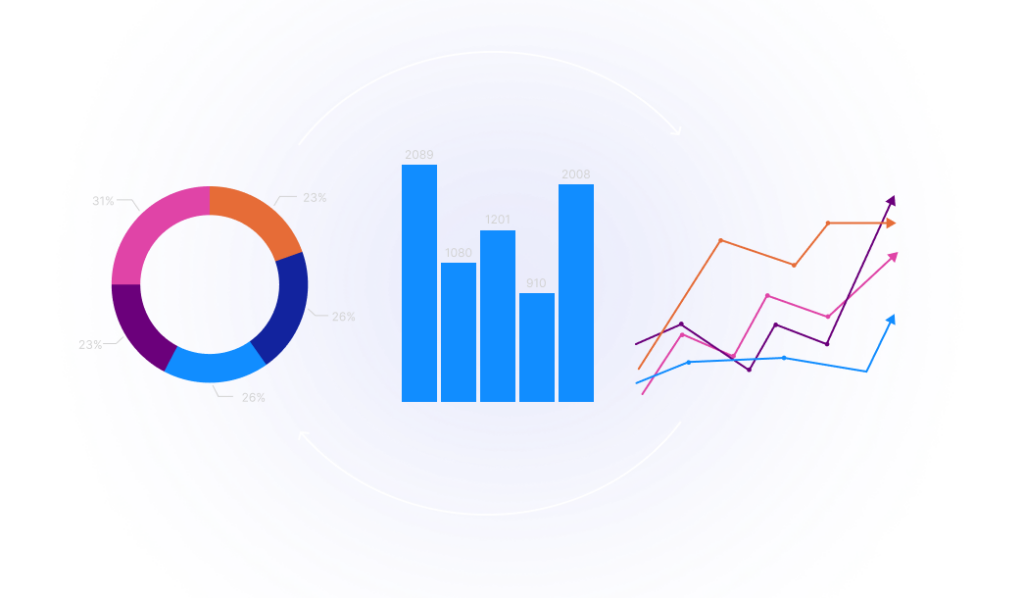
Just 15 minutes of your time uploading files using a template. No APIs, no technical setup. You always see the current state of your business, not data from two months ago.
Technical Support
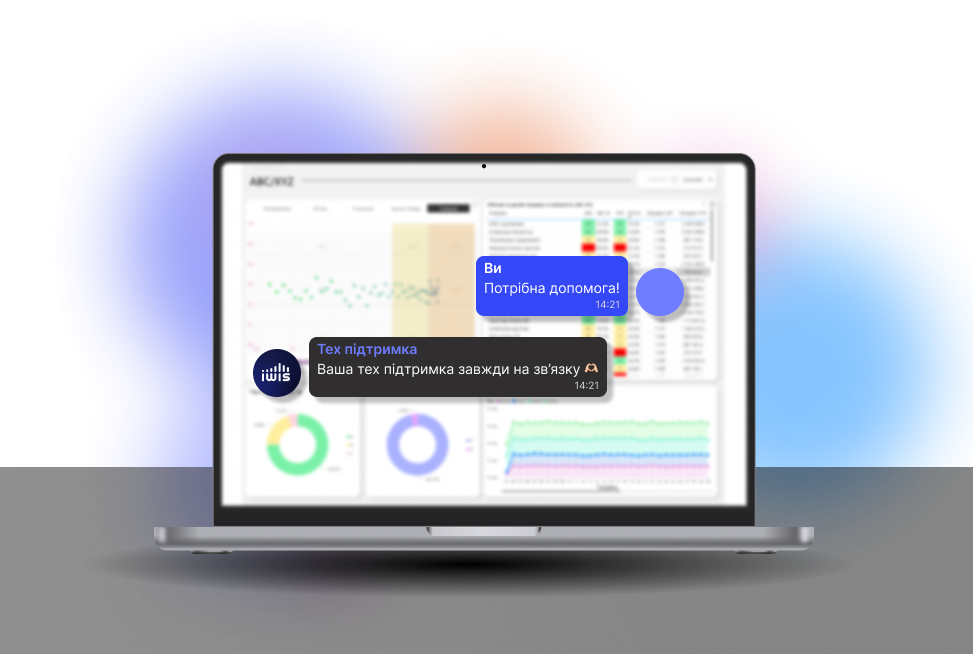
You are assigned a specific person who knows your system and your business. If something goes wrong, a question arises, or you need help interpreting data—you write directly to the manager, not to a general support chat without a name or face.
Training Materials
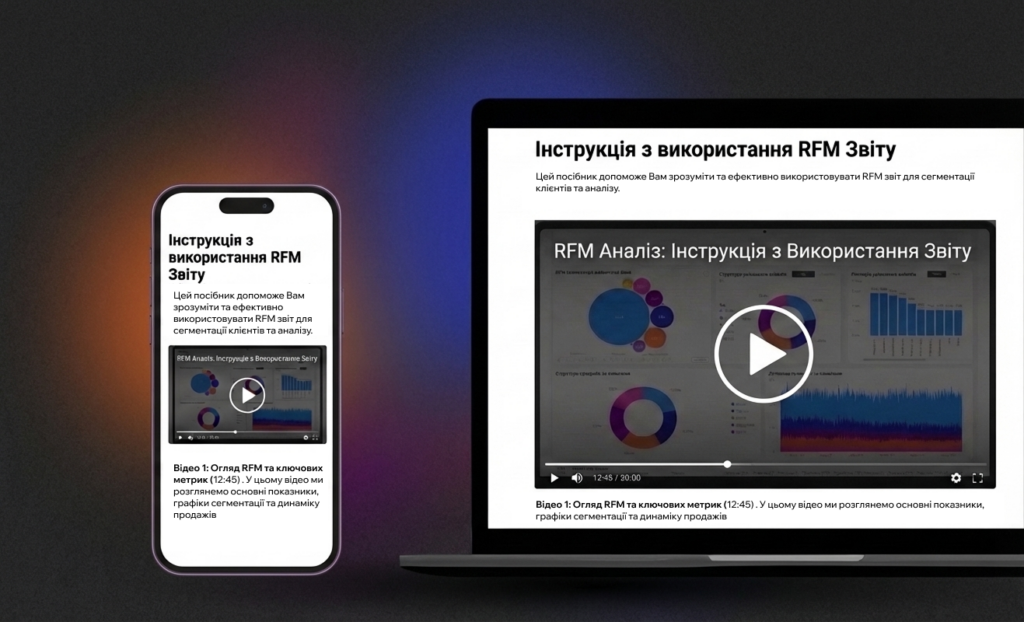
Many tools are purchased and not fully utilized—simply because it is unclear how to read the data correctly. Each dashboard includes a short video and text guide: what to look at, how to interpret metrics, and what decision follows from them.
Business Intelligence in 1 Day: 3 Steps to Launch Analytics
No integrations, no programmers, no technical tasks for a month ahead. From zero to a fully functional analytics system—one day.
Free Diagnostics
We analyze your business: what data you have, in what format, what tasks analytics should solve. Diagnostics takes 30–40 minutes and gives you a specific list of points where your e-commerce is losing money—regardless of whether you proceed further.
Data Upload Using Template
You receive ready templates for upload: orders, expenses, advertising data. The format is standard Excel or CSV, nothing new to learn. Preparation takes 1 to 3 hours depending on database volume.
Connection and Launch
You submit the completed files, we configure the dashboards and return a ready system. Your task is to review the results and ask questions. From this moment, business analytics for your e-commerce operates at full capacity.
Business Intelligence for E-commerce Is for You If…
E-commerce owner for 1+ years
Revenue from $15k+/month
2+ advertising channels
Existing customer base with regular sales
No unified profit analytics system
Business at a scaling or stress point
Frequently Asked Questions About Business Intelligence for Online Stores
What is financial analysis?
Financial analysis is an assessment of a company’s financial condition based on profitability, liquidity, and solvency indicators. In business analytics powered by Power BI, these indicators are calculated automatically from accounting system data and updated in dashboards along with the rest of the reporting.
What is business analytics and why does a company need it?
Business analytics is the set of processes, tools, and reporting that turn data from the company's various systems into information for making management decisions. Instead of scattered spreadsheets, an executive gets a single picture: finance, sales, and inventory in one place. This makes it possible to make decisions faster and based on facts rather than assumptions.
What is Power BI and why is it better than Excel?
Power BI is Microsoft's business analytics platform for collecting, processing, and visualizing data from various sources in interactive dashboards. Unlike Excel, the data updates automatically, without manual copying and the risk of errors in formulas. A single Power BI dashboard replaces dozens of files that used to be compiled by hand.
How much does a turnkey business analytics implementation cost?
The cost of implementation depends on the number of data sources, the complexity of the business logic, and the chosen analytics areas. The range can vary significantly depending on the scale of the project. We determine the exact price after a free diagnostics session, once it is clear what exactly needs to be connected and which model to build. A modular approach lets you start with one area and control the budget at every stage.
How does a Power BI implementation work: stages and timelines?
A Power BI implementation consists of five stages: diagnostics, data integration and consolidation, building the analytical model, developing the dashboards, and training the team. The first working analytics block is usually ready in 6-10 weeks. A full implementation covering all areas takes 3-5 months on average, depending on the number of systems.
What is data visualization and why does a business need it?
Data visualization is the presentation of figures as charts, diagrams, and interactive dashboards instead of tables. What data visualization means in practice: an executive sees the dynamics of the metrics and can explore the cause of a deviation in a few clicks, without waiting for a new report from an analyst. This saves hours of weekly manual work.