





Business Intelligence based on Power BI
Start making management decisions that directly impact profits
Why Business Intelligence based on Power BI is needed for your business
Implementing business analytics establishes an infrastructure where every number is verified, every source is synchronized, and the manager sees reliable data whenever needed. Data-driven decision-making becomes part of daily management work.

The only source of truth:
Finance, commerce, and operations finally work with the same numbers. Disputes in meetings and time spent trying to figure out whose data is correct disappear.

Management reporting without delays:
What previously took an analyst 2-3 days of work is now generated automatically. The manager receives up-to-date information exactly when it is needed.

Transparent Marginality:
Financial analytics show profitability by product, customer, and sales channel. Product and pricing decisions are based on real numbers.

Real-time deviation control:
A lag from the plan becomes visible at the moment it occurs and when it can still be influenced. Not at the end of the month, when the situation has already developed.

Current P&L without analyst requests:
Management sees the financial picture at any time. Different departments no longer receive different versions of the same metrics.

Automation instead of manual work:
Data is updated without human intervention. The risk of error due to the wrong formula or the wrong file is structurally removed, and does not depend on the attentiveness of a particular employee.
Signs
5 signs that your business needs a full-fledged Business Intelligence system
Management reporting is present in almost every company that has experienced the first stage of growth. But the presence of reports and the ability to quickly make decisions based on them are completely different things. The greatest danger is that the gap between them becomes noticeable not immediately, but when the cost of a late or wrong decision is already quite tangible.
Real cases of our clients

Stonelight – production

Helen Marlen Group – luxury retail

Planeta Kino – a chain of cinemas
What tasks does Business Intelligence solve?
Management reporting is present in almost every company that has experienced the first stage of growth. But the presence of reports and the ability to quickly make decisions based on them are completely different things. The greatest danger is that the gap between them becomes noticeable not immediately, but when the cost of a late or wrong decision is already quite tangible.
Financial analytics
The central unit for most customers. The one where the cost of an error or delay is the highest.
- P&L by product, channel, and division. CFO sees where profit is generated and where it is consumed. No manual summarization of ten tables.
- Marginal and profitability analysis. Detailing by SKU, client, region – where decisions about assortment and pricing are actually made. It becomes clear which positions, areas or contracts are dragging the business down.
- Plan-to-fact analysis and deviation control. Deviations from the budget are visible immediately, not at the end of the month. There is an opportunity to react while there is still time.
- Cash flow forecasting. Liquidity is planned based on current dynamics. Fewer surprises, fewer emergency decisions, more control over money.
Sales
Business analytics shows not the picture that managers want to show, but the one that the data confirms.
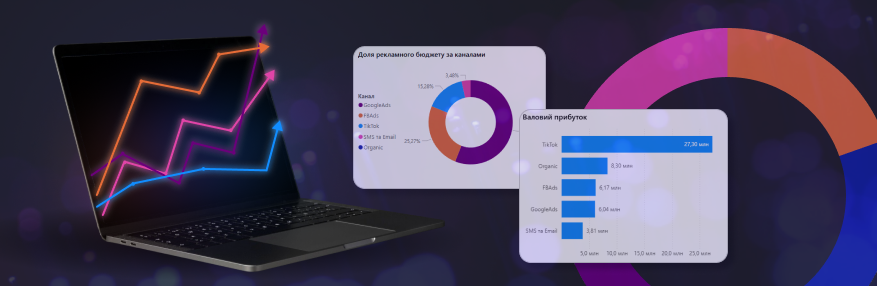
- Sales analysis by channel, customer, and region. It’s clear where revenue actually comes from and where there are hidden growth points.
- Evaluation of the effectiveness of promotions and discounts. Each campaign receives a financial assessment, the team sees which campaigns bring in money and which ones only create the illusion of activity.
- Determining the most profitable products. The portfolio is reviewed based on the actual profitability of each position. It becomes clear what needs to be pushed into sales, what needs to be revised in price, and what needs to be removed from the focus of attention.
- Monitoring the implementation of sales plans. The lag from the plan becomes visible at a time when it can still be corrected. Not only the fact of the slump is visible, but also the source of the problem: check, volume, structure, region, manager, channel.

Stocks and operations
Warehouse and finance live separately in most companies, and operational analytics shows how much what is on the shelves and what is missing is costing the business.
- Inventory control. Slowing down in turnover is captured before it turns into frozen capital.
- Out-of-stock and overstock analysis. Lost sales due to lack of goods and surpluses that put pressure on liquidity – everything is visible in one place.
- Data-driven procurement planning. Orders are formed based on real sales dynamics.
- Synchronize operational and financial metrics. Consolidating data between warehouse, purchasing, and finance eliminates the gap that is usually only apparent at inventory.

How we implement Business Intelligence: 5 stages from diagnostics to a working system
Dashboards are the final step, not the first. Before the first report appears, you need to understand what issues it should cover, where the data comes from, and why the numbers currently differ between departments.
Diagnosis of the current situation
First, we always analyze which management decisions are currently being made slowly or inaccurately, what data is in the systems and in what state, where conflicts arise between departments. Duration 1-2 weeks. At the end, the client receives a map of the current state of analytics and a list of priority tasks for the BI system.
Data integration and consolidation
Building an analytical model
Power BI dashboard development
System training and transfer
Who does BI work for?
CFOs and financial directors
CEOs and business owners
Head of Finance and financial managers
Commercial directors
CMOs and marketers
What is business analytics and why does a company need it?
Business analytics is the set of processes, tools, and reporting that turn data from the company's various systems into information for making management decisions. Instead of scattered spreadsheets, an executive gets a single picture: finance, sales, and inventory in one place. This makes it possible to make decisions faster and based on facts rather than assumptions.
What is Power BI and why is it better than Excel?
Power BI is Microsoft's business analytics platform for collecting, processing, and visualizing data from various sources in interactive dashboards. Unlike Excel, the data updates automatically, without manual copying and the risk of errors in formulas. A single Power BI dashboard replaces dozens of files that used to be compiled by hand.
How much does a turnkey business analytics implementation cost?
The cost of implementation depends on the number of data sources, the complexity of the business logic, and the chosen analytics areas. The range can vary significantly depending on the scale of the project. We determine the exact price after a free diagnostics session, once it is clear what exactly needs to be connected and which model to build. A modular approach lets you start with one area and control the budget at every stage.
How does a Power BI implementation work: stages and timelines?
A Power BI implementation consists of five stages: diagnostics, data integration and consolidation, building the analytical model, developing the dashboards, and training the team. The first working analytics block is usually ready in 6-10 weeks. A full implementation covering all areas takes 3-5 months on average, depending on the number of systems.
What is data visualization and why does a business need it?
Data visualization is the presentation of figures as charts, diagrams, and interactive dashboards instead of tables. What data visualization means in practice: an executive sees the dynamics of the metrics and can explore the cause of a deviation in a few clicks, without waiting for a new report from an analyst. This saves hours of weekly manual work.
Does Power BI integrate with BAS, SAP, CRM, and online stores?
Yes, Power BI can integrate with virtually any data source: BAS, SAP, CRM systems (Salesforce, HubSpot, and others), online store platforms, Google Analytics, Google Ads, and other marketing tools. Data from all sources is consolidated into a single storage and updates automatically in the dashboards. There is no need to replace your existing systems for this.